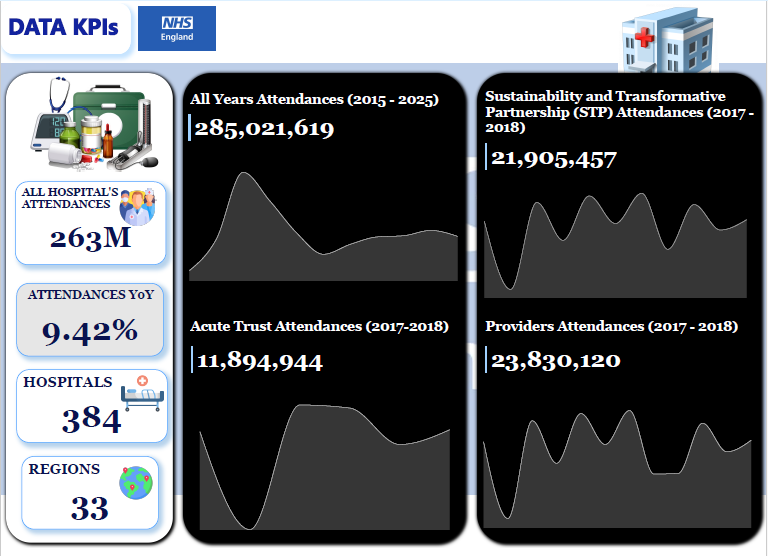
Harryville Solution Limited conducted an analysis of National Health Service (NHS), England – Accident and Emergency (A&E) data from 2015 to 2025. Below are some of the interesting things we found out.
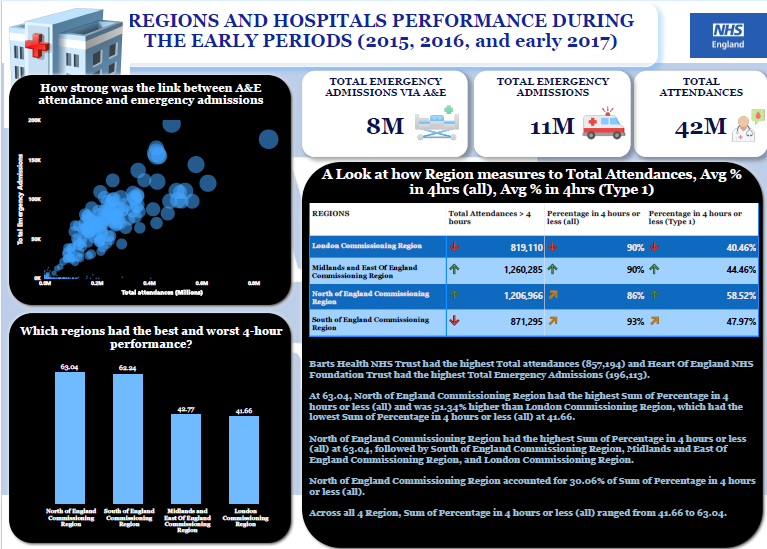
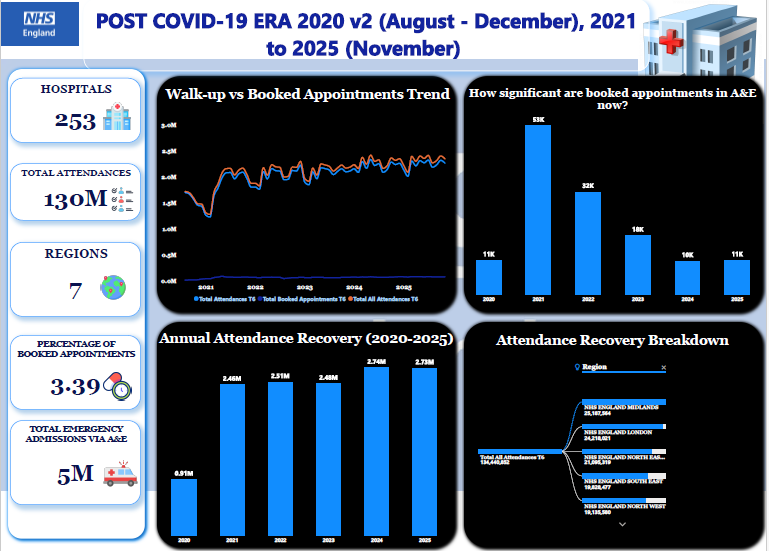
Barts Health NHS Trust had the highest Total attendances (857,194), and Heart of England NHS Foundation Trust had the highest Total Emergency Admissions (196,113). At 63.04, the North of England Commissioning Region had the highest Sum of Percentage in 4 hours or less (all) and was 51.34% higher than the London Commissioning Region, which had the lowest Sum of Percentage in 4 hours or less (all) at 41.66. The North of England Commissioning Region had the highest Sum of Percentage in 4 hours or less (all) at 63.04, followed by the South of England Commissioning Region, the Midlands, the East of England Commissioning Region, and the London Commissioning Region. The North of England Commissioning Region accounted for 30.06% of the total percentage for 4 hours or less (all). Across all 4 regions, the sum of Percentage in 4 hours or less (all) ranged from 41.66 to 63.04.
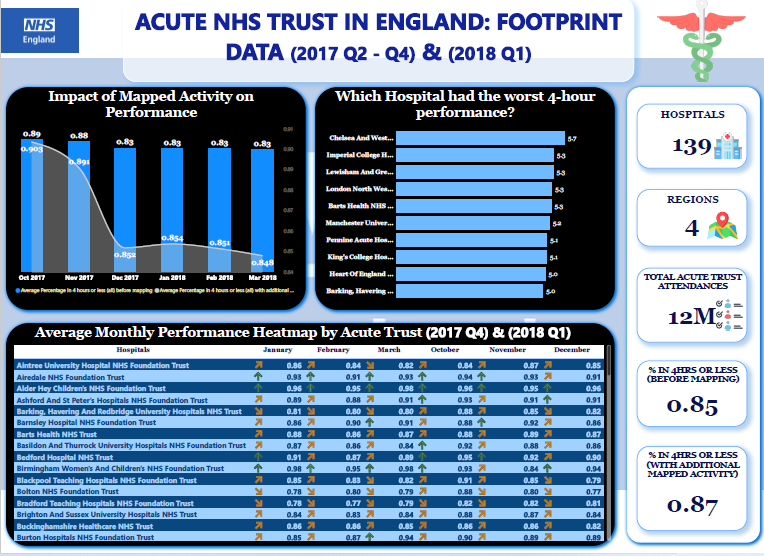
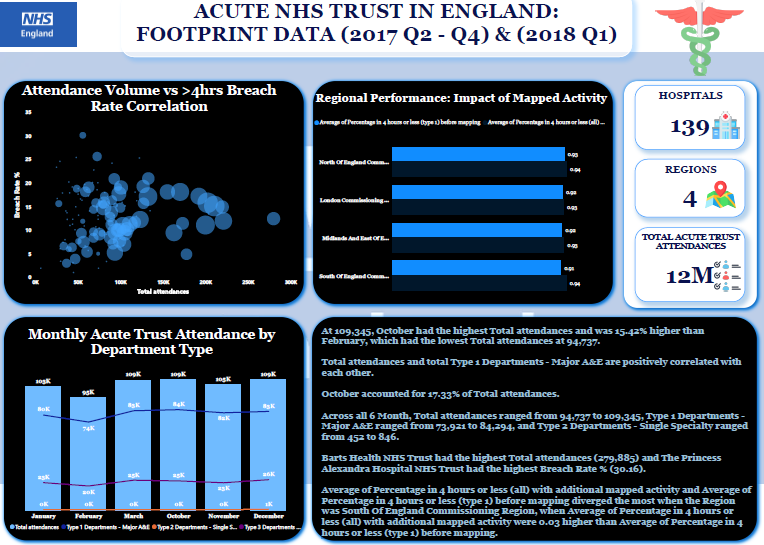
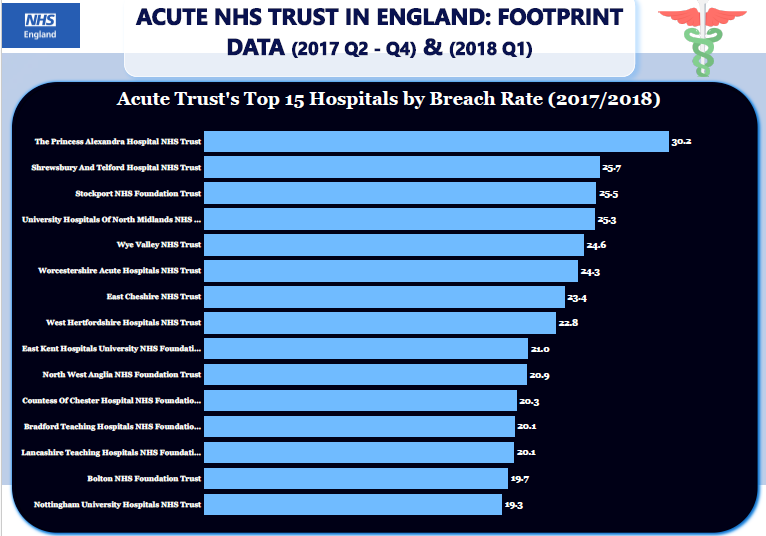
At 109,345, October had the highest total attendance, 15.42% above February, which had the lowest at 94,737. Total attendances and total Type 1 Departments – Major A&E are positively correlated. October accounted for 17.33% of Total attendances. Across all 6 Months, Total attendances ranged from 94,737 to 109,345; Type 1 Departments – Major A&E ranged from 73,921 to 84,294; and Type 2 Departments – Single Specialty ranged from 452 to 846. Barts Health NHS Trust had the highest Total attendances (279,885), and The Princess Alexandra Hospital NHS Trust had the highest Breach Rate % (30.16). Average of Percentage in 4 hours or less (all) with additional mapped activity and Average of Percentage in 4 hours or less (type 1) before mapping diverged the most when the Region was South Of England Commissioning Region, when Average of Percentage in 4 hours or less (all) with additional mapped activity were 0.03 higher than Average of Percentage in 4 hours or less (type 1) before mapping.
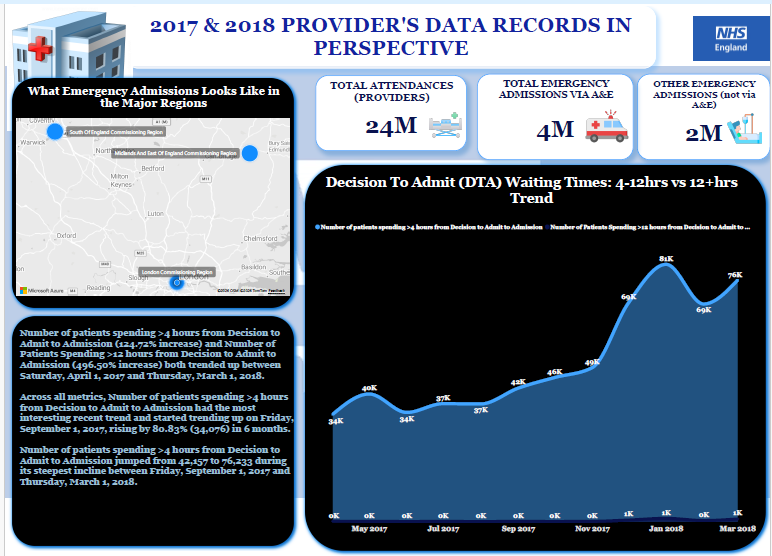
The Number of patients spending >4 hours from Decision to admit to Admission (124.72% increase) and the Number of Patients Spending >12 hours from Decision to admit to Admission (496.50% increase) both trended up between Saturday, April 1, 2017, and Thursday, March 1, 2018. Across all metrics, the number of patients spending >4 hours from Decision to Admit to Admission showed the most interesting recent trend, starting to rise on Friday, September 1, 2017, by 80.83% (34,076) in 6 months. The number of patients spending >4 hours from Decision to Admit to Admission increased from 42,157 to 76,233 during its steepest incline between Friday, September 1, 2017, and Thursday, March 1, 2018.
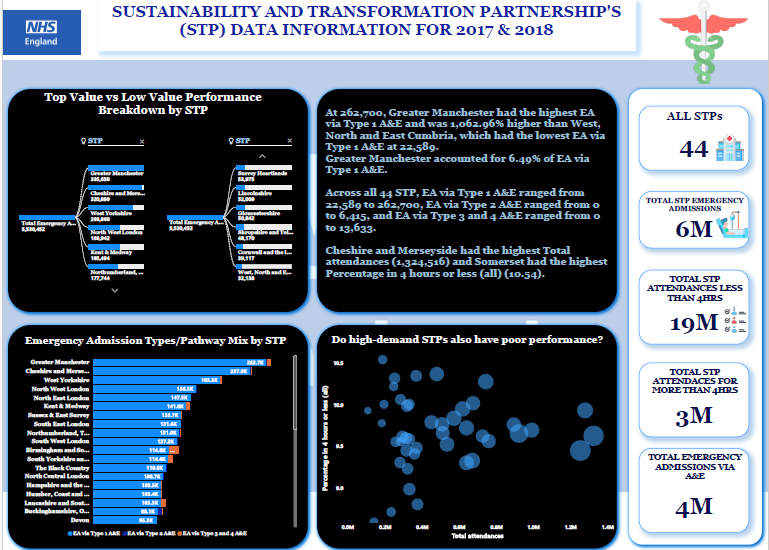
At 262,700, Greater Manchester had the highest EA via Type 1 A&E and was 1,062.96% higher than West, North, and East Cumbria, which had the lowest EA via Type 1 A&E at 22,589. Greater Manchester accounted for 6.49% of EA via Type 1 A&E. Across all 44 STPs, EA via Type 1 A&E ranged from 22,589 to 262,700, EA via Type 2 A&E ranged from 0 to 6,415, and EA via Type 3 and 4 A&E ranged from 0 to 13,633. Cheshire and Merseyside had the highest Total attendances (1,324,516), and Somerset had the highest Percentage in 4 hours or less (all) (10.54).
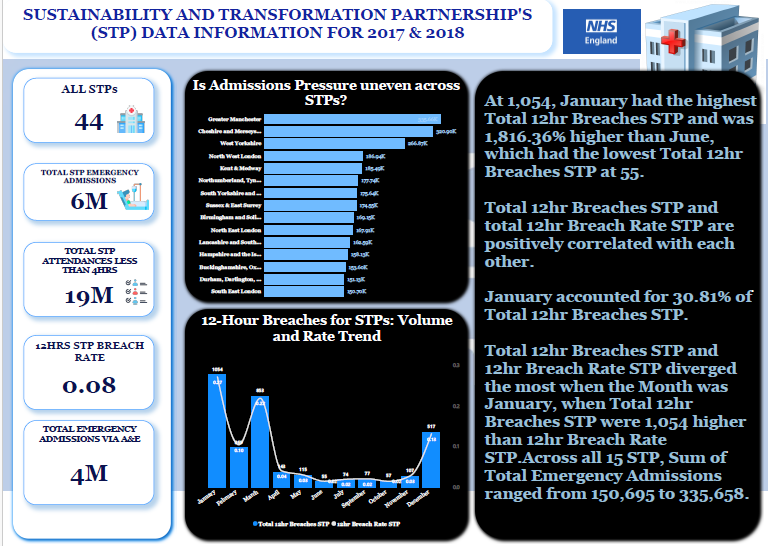
At 1,054, January had the highest Total 12hr Breaches STP and was 1,816.36% higher than June, which had the lowest Total 12hr Breaches STP at 55. Total 12hr Breaches STP and total 12hr Breach Rate STP are positively correlated with each other. January accounted for 30.81% of the total 12-hour breaches STP. Total 12hr Breaches STP and 12hr Breach Rate STP diverged the most in January, when Total 12hr Breaches STP were 1,054 higher than 12hr Breach Rate STP. Across all 15 STPs, the total number of emergency admissions ranged from 150,695 to 335,658.
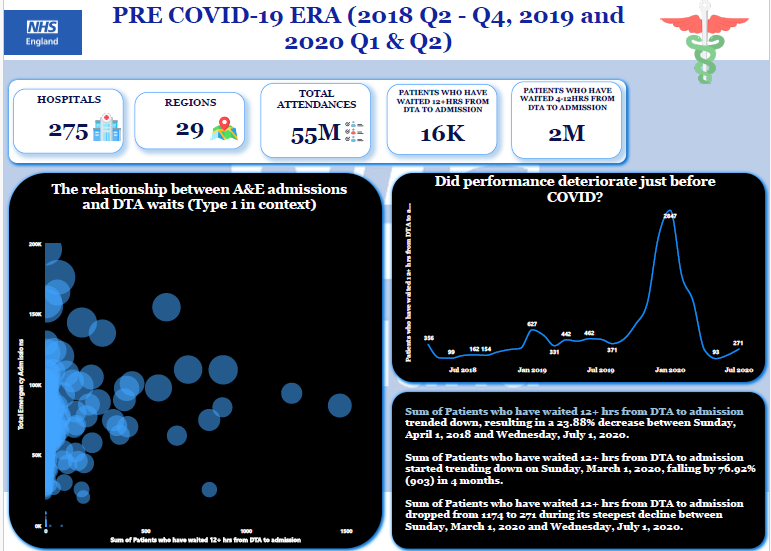
The number of Patients who waited 12+ hrs from DTA to admission trended downward, resulting in a 23.88% decrease between Sunday, April 1, 2018, and Wednesday, July 1, 2020. The number of Patients who have waited 12+ hrs from DTA to admission started trending down on Sunday, March 1, 2020, falling by 76.92% (903) over 4 months. The sum of Patients who have waited 12+ hrs from DTA to admission dropped from 1174 to 271 during its steepest decline between Sunday, March 1, 2020, and Wednesday, July 1, 2020.
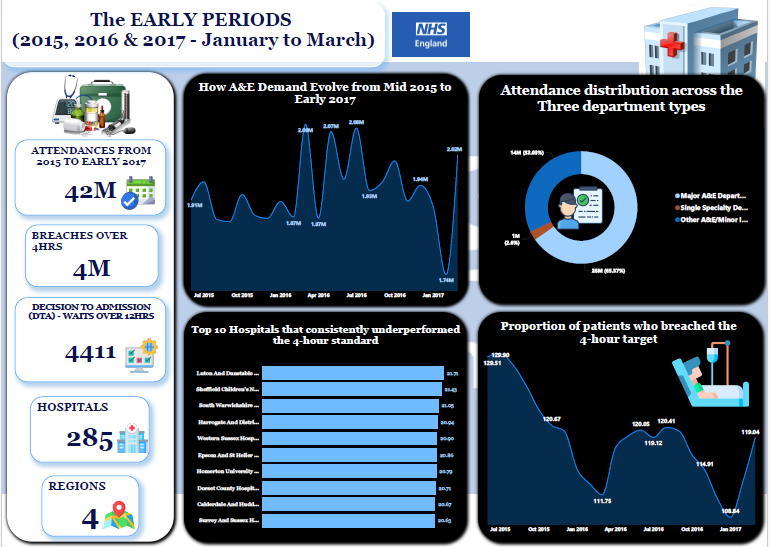
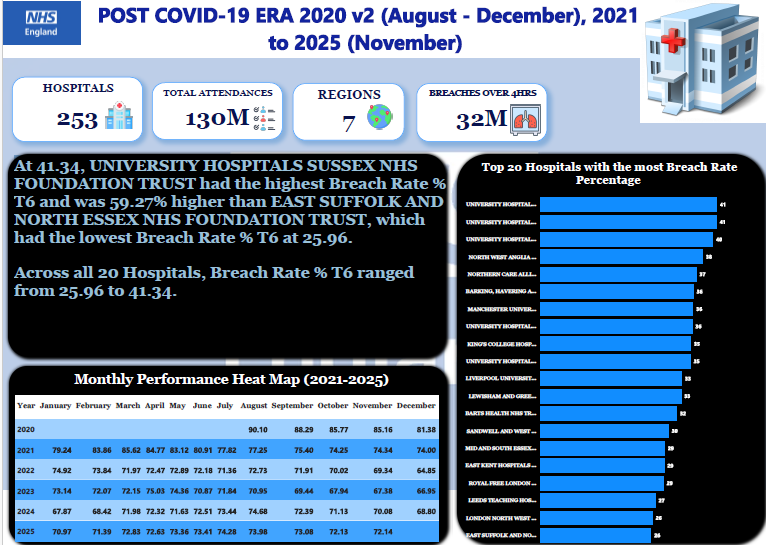
At 41.34, University Hospitals Sussex NHS Foundation Trust had the highest Breach Rate % T6 and was 59.27% higher than East Suffolk And North Essex NHS Foundation Trust, which had the lowest Breach Rate % T6 at 25.96. Across all 20 Hospitals, Breach Rate % T6 ranged from 25.96 to 41.34.
To download the analysis in pdf, click here